Description
How to Purchase
✅ Instant Delivery (No Physical Delivery Required)
✅ Before you buy, make sure you read the Terms and Conditions
✅ If you agree to buy, you have agreed to the terms and conditions of no refunds if the reason is as described Terms and Conditions
✅ License for one PC, and cannot be transferred to another PC
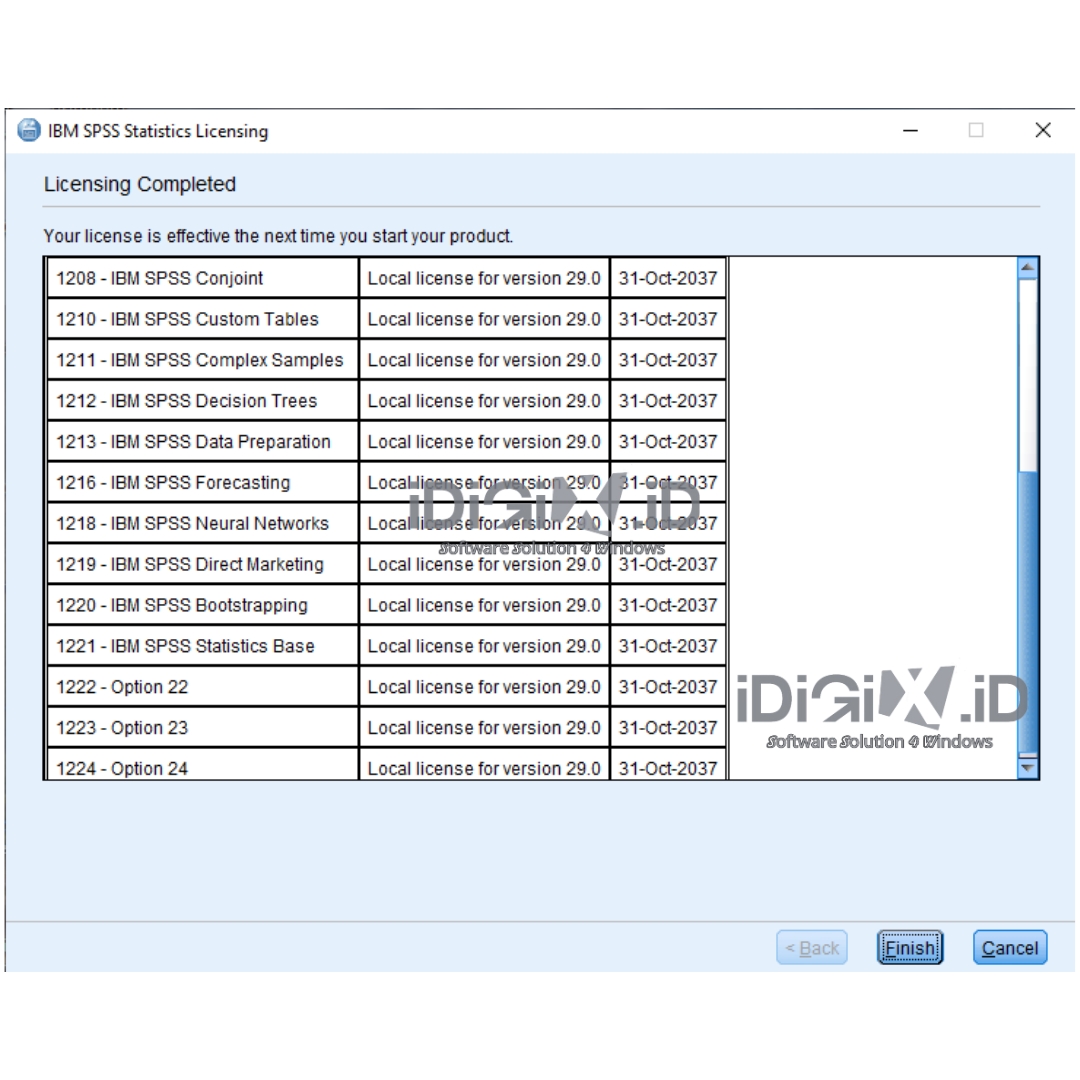
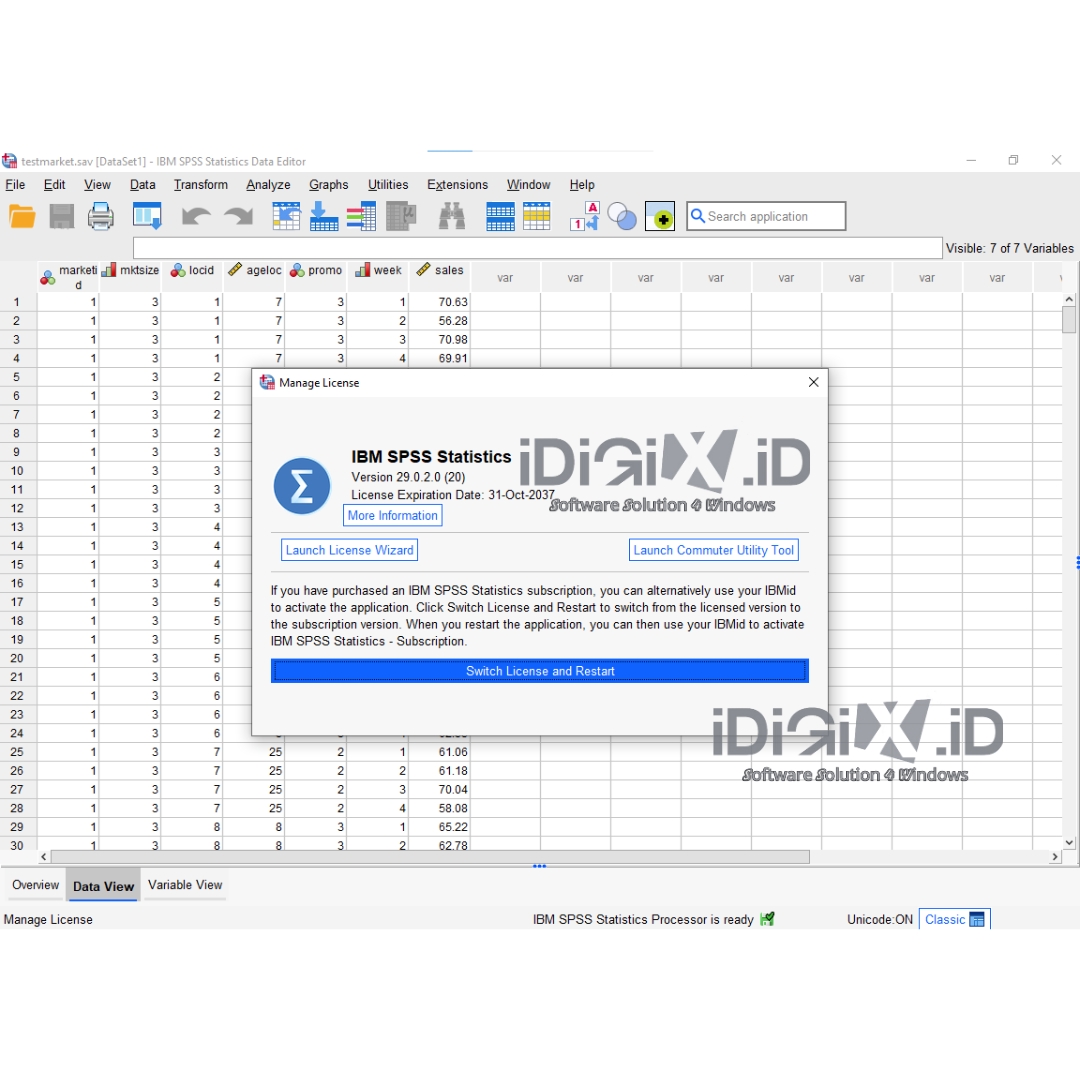
✅ Active Period: License is active until 2037
✅ Support: Windows 10, 11, Mac (M1 M2 M3 M4 Can Use)
✅ Update Application: No
✅ Install Instructions: Available (video/text)
✅ It should be noted, buying = understanding product use
Note:
It should be noted buying = understanding product use
Files & Prices may increase or decrease at any time
By buying, it means that you have agreed to all the Terms and Conditions that our store has provided
Description:
BUY IBM Statistics SPSS 29.2 For Windows and MacOs Full Version
What’s New in IBM SPSS Statistics v30?
Posted on
Looking to learn what’s new in IBM SPSS Statistics 30 quickly? Rather than reading a list of changes and new procedures, there is a quick way to tour what’s new.
Take a Tour of What’s New in IBM SPSS Statistics
To learn what’s new in IBM SPSS Statistics Version 30, click the File menu and select the Welcome Dialog option. The’ What’s New’ section is on the right side of the Welcome Dialog box. Here, you can click through new features in IBM SPSS Statistics using the arrow buttons.
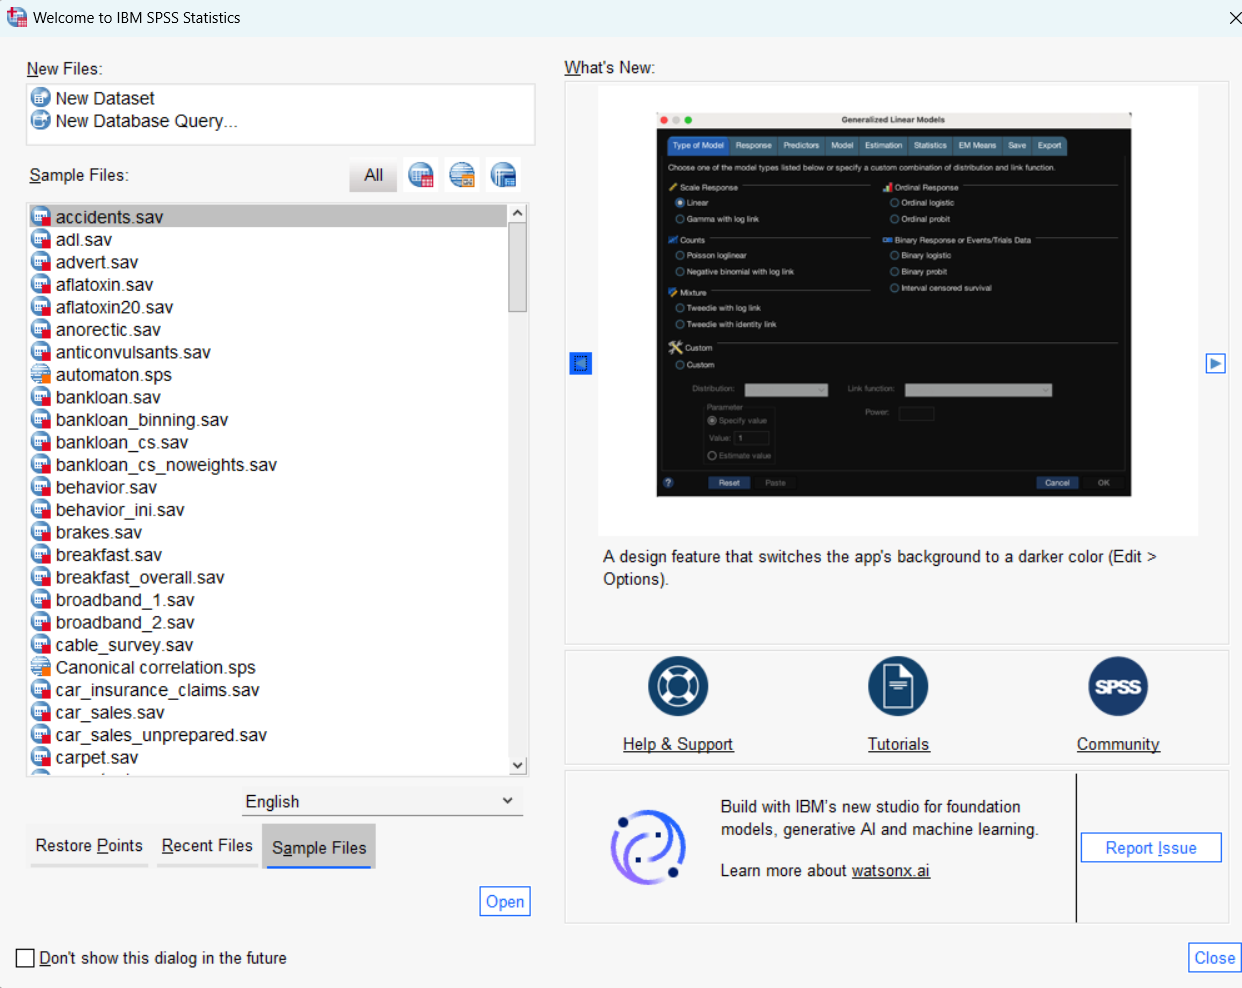
Dark Mode
Users can now work in Dark Mode. To do so, go to the Edit menu and select Options. On the General Tab, go to the Look and Feel section and select Dark Mode. Click OK and dark mode is activated.
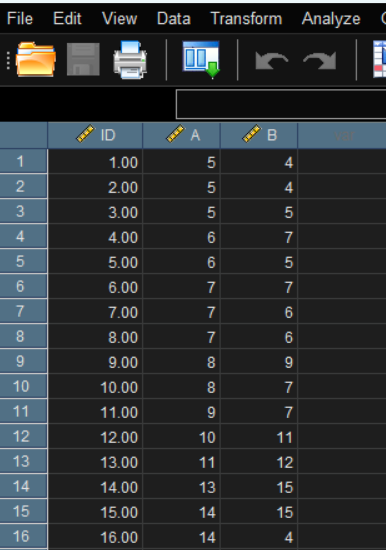
Text Scaling
There is also a new option for Text scaling on 4k HD monitors for Windows. To set this, go to the Edit menu and select Options. Select the General tab. Text scaling applies to the menus, dialog boxes, Data Editor, Syntax Editor, Outline Pane, pivot tables, charts, and text outputs.
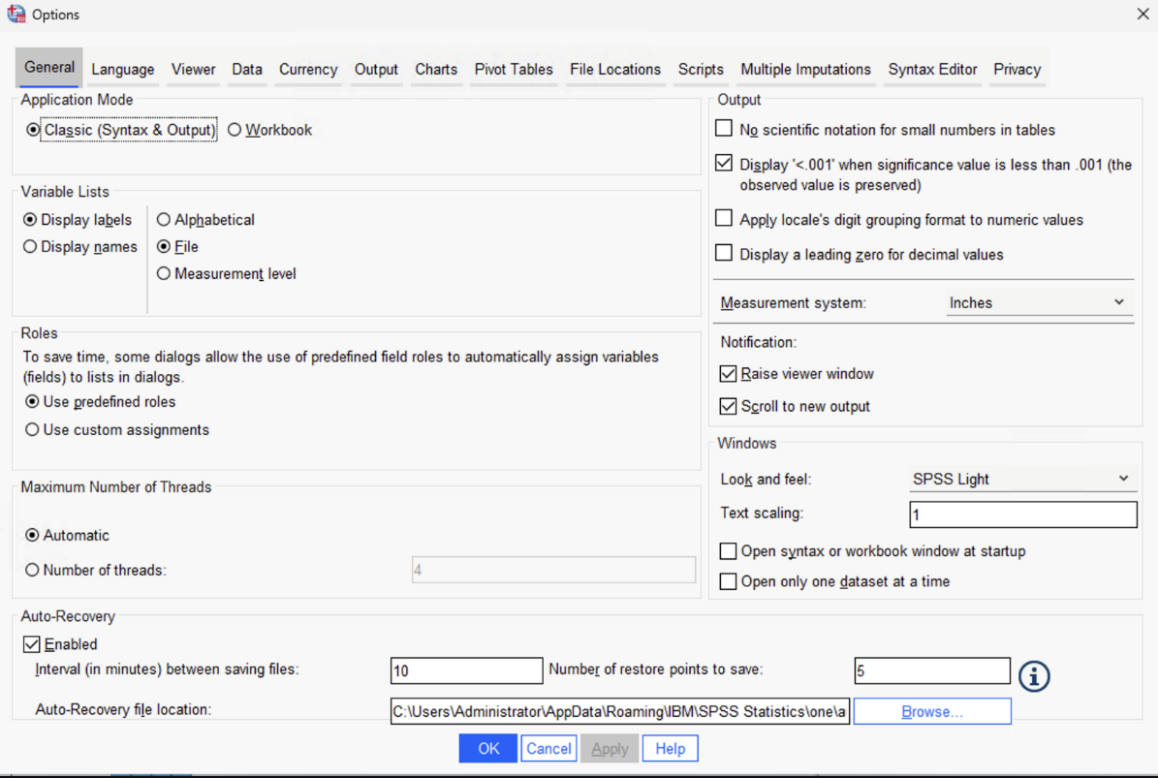
Redesigned Tool Bar
The Toolbar is redesigned to provide you with quick and easy access to the tools you need. Tools for Variable Sets, the Welcome Dialog, Syntax, and Output are placed together in one area of the Toolbar.

When you click on the Variable Sets tool, a dialog box opens, allowing you to select Variable Sets for analysis with just a few clicks. Clicking on the Welcome Dialog tool opens a window where you can find sample data files, learn about the latest updates, and access support. Clicking on the Syntax or Viewer tools will either open a new syntax or viewer file, or bring up your active files.
Bland-Altman Analysis
Bland-Altman Analysis is now available in IBM SPSS Statistics. Bland-Altman Analysis evaluates the agreement among two different instruments or two measurement techniques and provides a useful visualisation.
The resulting graph is a scatter plot. The Y axis shows the difference between the two paired measurements and the X axis represents the average of these measures. The difference of the two paired measurements is plotted against the mean of the two measurements.
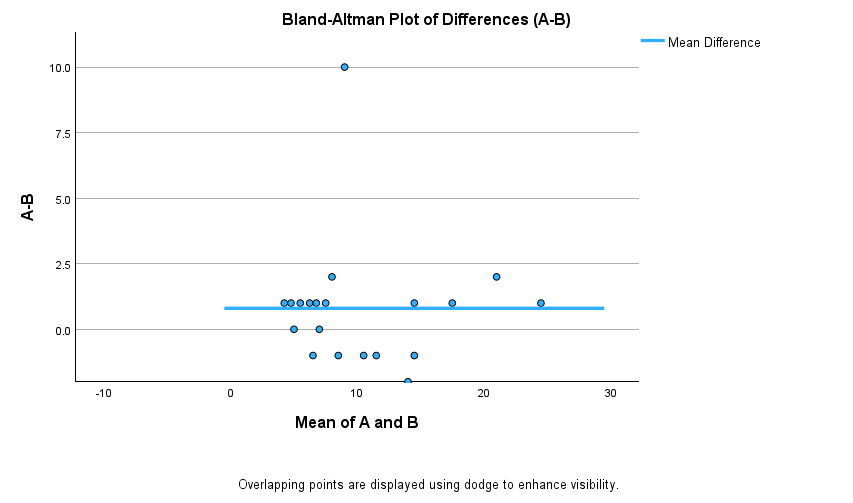
Users can obtain the graph along with each case, the Mean, the Difference, and the Difference / Mean. Users can also adjust criteria, output and plot settings.
Normality Analysis
The Normality Analysis procedure allows users to determine the univariate and multivariate normality of a set of variables. The tests now available are listed below.
The Multivariate Normality tests:
- Mardia
- Royston
- Henze-Zirkler
- Doornik-Hansen
- Energy
The Multivatiate Normality plots
- Chi-Square Q-Q
- Perspective
- Contour
The Univariate Normality tests:
- Anderson-Darling
- Shapiro-Wilk
- Cramér-von Mises
- Shapiro-Francia
- Lilliefors (Kolmogorov-Smirnov)
The Univariate Normality plots:
- Histogram
- Box Plot
- Q-Q Plot
- Scatter Plot
For example, a user may want to use the Energy Test to assess multivariate normality of a set of variables in a high-dimensional data set.
Normality Analysis must be downloaded and installed from the Extensions Hub. Users can go to the Extensions menu and select Extension Hub. Users can search for ‘Normality Analysis’ and select ‘Get extension’ to download and install the extension.
To use the procedure, go to the Analyze menu and select Descriptive Statistics. Click on Normality Analysis. Select variables to include in the analysis and click on the Tests and Plots tab and select the desired tests and plots. Clicking on the Outliers tab provides options to show multivariate outliers.
Find and Replace in Multiple Columns
Users can now search for values across multiple columns and replace values in the entire selected area. This will speed up the process of finding and replacing values in a large data set.
More Changes
There are more changes. These are:
- JRE and JDK are upgraded to 17.0.11.
- IBM SPSS Statistics trial users can when their trial ends when opening Statistics. The Manage License option also shows this information.
- The connection issue of IBM SPSS Statistics and Statistics Adapter with IBM SPSS Collaboration and Deployment Services Repository has been resolved.
- The issue of the connection issue between contemporary versions of IBM SPSS Statistics and IBM SPSS Collaboration and Deployment Services is now working.
- R is upgraded from version 4.2.0 to 4.4.1.
Summary
In addition to the most recent changes to IBM SPSS Statistics, R and Python are installed with SPSS. The Extensions Hub provides users access to over 70 analytical techniques that can be installed into SPSS. These changes, combined with the existing statistical procedures, make IBM SPSS Statistics a complete and comprehensive statistical platform.

Michal Faron (verified owner) –
Super useful software. Extremely quick response customer service. Everything works in a easy way. THANK YOU.
thejansoft (store manager) –
Thank you
Ersan Talu (verified owner) –
I installed the software without any problems. They provided continuous support throughout the process. Everything was as fast and perfect as it should be. Thank you very much.
Raúl (verified owner) –
Fast and completely trustworthy, this is the second time I have used their services and I have always received a good response. Totally recommendable.
Michal F. (verified owner) –
GREAT SERVICE
Anonymous (verified owner) –
smooth and effortless transaction
Anonymous (verified owner) –
Luz (verified owner) –
Wonderful
Adrian (verified owner) –
Works as expected !