Description
How to Purchase
✅ Instant Delivery (No Physical Delivery Required)
✅ Before you buy, make sure you read the Terms and Conditions
✅ If you agree to buy, you have agreed to the terms and conditions of no refunds if the reason is as described Terms and Conditions
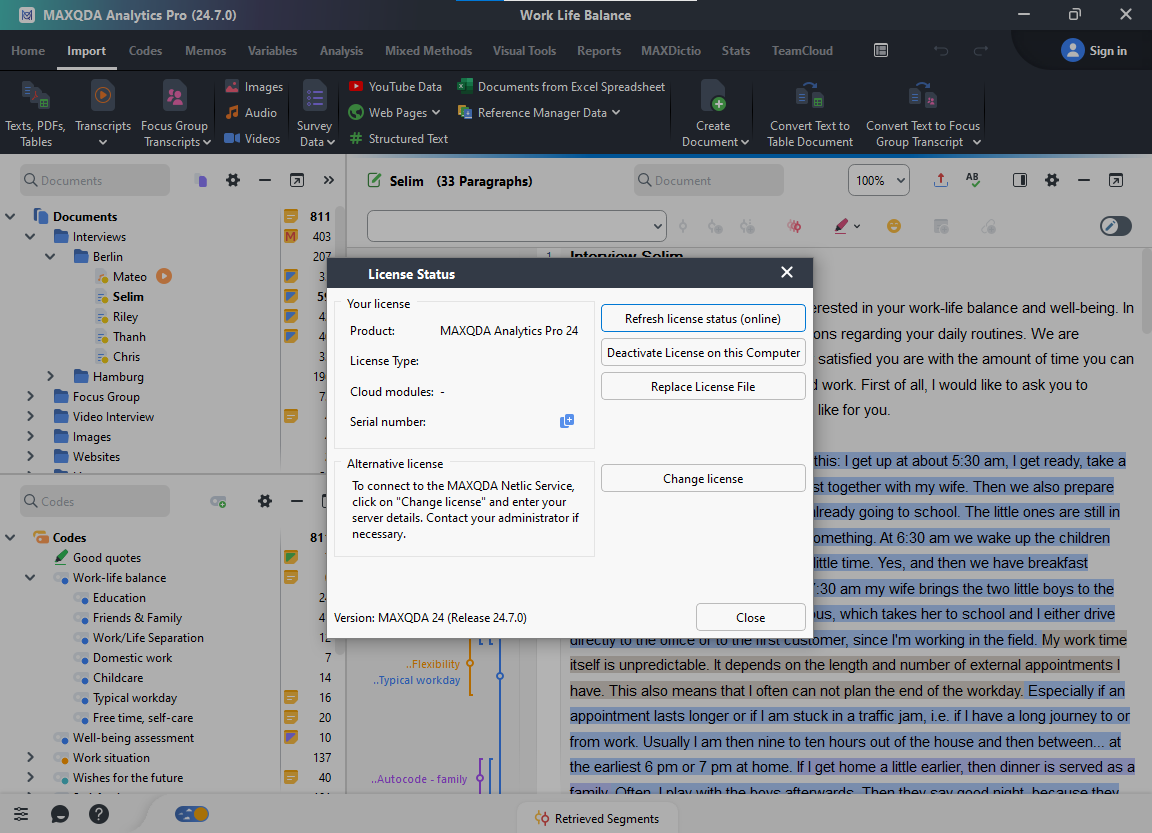
✅ 1PC license only means that it can only be used on 1 PC, the license cannot be transferred to another PC.
✅ Active Period: Lifetime (can reinstall)
✅ Support: Windows 10, 11
✅ Update Application: No
✅ Install Instructions: Available (video/text)
✅ It should be noted, buying = understanding product use
AI features not working It’s online plugin , need paid account
Note:
It should be noted buying = understanding product use
Files & Prices may increase or decrease at any time
By buying, it means that you have agreed to all the Terms and Conditions that our store has provided
Release 24.8 (March 4th, 2025)
[NEW]
- Serendipity
- The new Serendipity feature can be found in the Retrieved Segments window toolbar. You can use it to highlight a random selection of all the coded segments currently listed in the window.
- Try your luck, and you might stumble across an accidental discovery in your data that you would have overlooked otherwise.
[IMPROVED]
- MAXDictio
- MAXDictio Comments: Add comments to your dictionary categories or stop/go word lists to easily remember what your goal for each category was.
- Keyword in Context/Word Matrix Browser: Easily refine your searches by selecting a specific dictionary or word list, so you can always pick the correct collection of words for your search.
- Word Frequencies: Up to 5x faster! Enjoy a significantly improved performance, when analyzing word frequencies across multiple documents at once.
- Smart Coding Tool
- Code Favorites: You can now use the code favorites to code your data directly in your SCT windows to ensure a smooth coding experience.
- Code Statistics: Quickly view the frequencies of your subcodes by creating subcode statistics without having to leave the analysis workspace.
- More improvements
- Interface: Newly designed tooltip pointers and steppers to ensure usability and a fresh, modern design.
- Tooltip Toggle: Take control of your interface with new window settings that allow you to enable or disable tooltips for documents and code.
- Japanese: The Parts of Speech Filter functionality in Word Frequency tables and Word Clouds now supports Japanese text data.
- Transcripts: Improved support for a broader range of timestamp formats in .VTT transcripts ensure smoother imports.
- PDF Export: The PDF export option menu was streamlined. All available export options (including the export with visualized coding stripes and memos) are now available in one single “Export” menu.
- TeamCloud: Users can now open their TeamCloud workspace directly from within MAXQDA to easily access their data.
- File Icons: New, modern icons for .mx24 and backup files.
[FIXED]
- Fixes an issue where printing the list of retrieved segments via the respective icon was not possible.
- Fixes an issue where an incorrect tooltip was displayed when hovering over the export option in the Document Map.
- Fixes an issue where labels for Emoticodes in the Code Matrix Browser were missing.
- Fixes an issue where visualized coding stripes were not displayed in the print preview when printing activated documents.
- Fixes an issue where labels of elements in MAXMaps were inserted outside of the visible map area.
- Fixes an issue where multiple levels of subcodes were not aggregated correctly in the Code Frequencies.
- Fixes an issue where applying codes did not work correctly while editing Japanese transcripts.
- Fixes several minor interface issues.
Release 24.7 (December 17th, 2024)
[NEW]
- Extract Text from Images
- Discover a new level of efficiency with MAXQDA’s new OCR (Optical Character Recognition) feature, designed to extract text from scanned documents and images.
- Select an area in a scanned PDF (for example a page from a book) and ask MAXQDA to extract the text in the area. You can review and modify the text if necessary, save it as a memo, or as a new document.
- Filter Parts of Speech
- Enhance your text analysis with smarter word frequency tools. Our updated word frequency analysis now automatically recognizes different word types in text data.
- You can filter both word clouds and frequency tables for specific parts of speech, such as adjectives and nouns, allowing you to fine-tune the displayed data and visualize only the information most relevant to your research.
[IMPROVED]
- AI Assist
- Explain This: We’ve improved AI explanations with a convenient pop-up window. Now, you can choose to save the explanation in a memo, copy it to your clipboard, or discard it without cluttering your project data.
- AI Ribbon: The feature “Summarize Paraphrases” has been added to the AI Ribbon menu for easier accessibility.
- AI Chat History: When your AI Chat is transferred to the chat history, the references are now kept active and visible to ensure transparency.
- More improvements
- Code Matrix Browser: Display the nodes in the Code Matrix Browser in their code colors to quickly identify patterns across themes.
- Memos: The document browser sidebar now shows all the memos in a document, so you can easily access and view your notes and remarks on text passages.
- Interface: Several smaller interface improvements to simplify and group options into easy-to-understand menus. For example moving the “Print” options into the “Export” menus.
- External Files: When opening external files, MAXQDA now checks the external files folder first, ensuring better data access.
- Code/Document Maps: While creating a new map, you’ll see some guidance about the first steps you need to fill the map with data, which will help new users.
[FIXED]
- Fixes an issue where several keyboard shortcuts were not functional.
- Fixes an issue where it was not possible to merge codes in the code system while the local search was active.
- Fixes an issue where overlapping codes in the Code Map were clustered too narrowly and not clearly distinguishable.
- Fixes an issue where it was not possible to use AI Coding from the AI ribbon menu.
- Fixes an issue where only a maximum number of 30 worksheets could be displayed in QTT workspace.
- Fixes an issue where the AI Chat did not work for user names containing special characters.
- Fixes an issue where clicking on a code in the Code Map did not highlight the code in the document system.
- Fixes an issue where renaming a code in the code system positioned the code at the bottom of the code system.
- Fixes an issue where it was not possible to import multiple memos with identical names to a QTT worksheet.
- Fixes several minor interface issues.
Release 24.5.1 (September 4th, 2024)
[FIXED]
- Fixes an issue in Creative Coding that prevented users from creating new codes. You can now freely modify your code structure and add new codes again.
- Fixes an issue where some icons were missing in the Mixed Methods and Stats selection dialogues.
[IMPROVED]
- Visual Tools
- MAXMaps: We have added a new free-from element to visualize text on the map: a speech bubble.
- MAXMaps: Adding new elements is now more intuitive. They will appear in a diagonal line within the visible part of the map.
- MAXMaps: Element grabbers are now even easier to use.
- MAXMaps: The currently open map is now highlighted in bold in the list of maps, making it easier to identify.
- Creative Coding: When transferring changes to the code system, the project file is automatically backed up. This allows users to easily restore maps to their previous state.
- Document Comparison Chart: The feature is now available for media files.
- Word Trends: Lemmatized words are now displayed in the tooltip within the legend.
- Word Trends: Users can now pin their chosen words to keep them visible in the legend.
- Trends for multiple documents: It is now possible to compare document groups and sets.
- Word Cloud: Easily activate all documents containing a specific word via an option in the context menu.
- Code Matrix Browser: Easily select specific document sets you want to visualize.
- More improvements
- AI Assist: Users can now summarize a coded segment directly from the comment dialog.
- AI Assist: Increased speed for summarizing segments into coding comments in the Smart Coding Tool and Categorize Survey Data workspaces.
- AI Chat: Copied AI Chat responses now retain their original formatting.
- AI Chat: The font size of the AI Chat window now adapts to the user settings for large text sizes making it easier to read.
- AI Chat: The AI Chat with Coded Segments has been added to the context menu of single codes in the Smart Coding Tool and Categorize Survey Data workspace.
- PDF Documents: When areas are excluded from a PDF document, they will also be excluded when the PDF is saved as a text document.
- Import: Transcripts from .vtt can now be imported using different line formats.
- Interface: Several smaller interface adjustments and improvements.
[FIXED]
- Fixes an issue in QTT where in some cases data was not retained correctly.
- Fixes an issue while starting MAXQDA where the start screen was always displayed in German language.
- Fixes an issue while importing transcripts where bold text formatting was not imported properly.
- Fixes an issue while performing a complex coding query where the “Overview of Coded Segments” was empty when opened from the retrieved segments window.
- Fixes an issue while working with MAXQDA on a second screen where the AI Chat window was opened in the background and was not visible.
- Fixes an issue where using keyboard shortcuts in text editing tools in MAXQDA was not possible.
- Fixes an isshue while importing transcripts from “Fireflies” where the imported document was imported without content.
- Fixes an issue while activating documents where the number of activated documents was not updated in the Smart Coding Tool.
- Fixes an issue while rearranging codes in the Smart Coding Tool where changes were not transferred to the Code System window.
- Fixes several minor interface issues.
[FIXED] MAXQDA Release 24.2 (February 12th, 2024)
- Fixes an issue while coding with a new code in a large project file where the coding process was slow.
- Fixes an issue while opening the search results for a word in the word cloud that has been created from categorize survey data where the search result was not listed.
- Fixes an issue while saving a project with MAXQDA 24 as a .mx22 file where directly opening the file with MAXQDA 24 again failed.
- Fixes an issue while staying logged in to the MAXQDA user account where holders of student licenses had to log in again multiple times.
- Fixes an issue while playing media files in the Multimedia Browser where manually entering a time in the spinbox did not work properly.
- Fixes an issue while exporting coded segments from the retrieved segments window where the code and document names were not properly exported when the retrieved segments window was closed.
- Fixes an issue while moving the cursor out of a selection in a video file where the video image was not updated.
- Fixes an issue while navigating search hits with keyboard shortcuts. Users can now use “Enter” or “Shift+Enter” to jump to the next or previous search hit.
- Fixes an issue while creating a longer code summary in a code memo where scrolling was not possible.
- Fixes an issue with table designs in Stats selection dialogues.
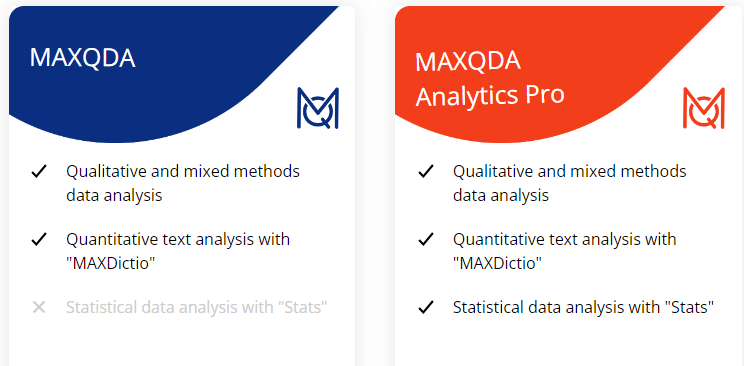
Descriptive statistics in Maxqda Analytics Pro 2024
Create base plots to compare frequencies and percentages for variables or codes.
Frequency tables are interactive – delete and merge columns or rows with automatic recalculation of percentages.
Create customizable charts and graphs for your results and copy them to the output display or directly into your reports and presentations.
Calculate descriptive statistical parameters including mean, standard deviation, variance, quartiles, median and range.
Compare groups in Maxqda Analytics Pro 2024
There are various methods to discover the relationship between two or more variables.
Crosstab is one of the basics that no statistical program can be without:
They are easily customizable and can provide valuable insight for everyone, not just statisticians
Highlighting features make interpretation of results quick and easy.
If you are looking for something more advanced, you can compare the effect of one factor in different groups with ANOVA .
Correlation in Maxqda Analytics Pro 24
One of the most basic statistical methods for discovering connections within your data is examining correlations .
The Stats module enables you
To calculate two commonly used correlation coefficients with a few mouse clicks: Pearsons r and Spearmans Rho
Scale, Compute & Recode
Creating a custom scale can be a great way to accurately measure the dimensions you are most interested in.
Compute Cronbach’s Alpha to check reliability .
Store the scales as new variables and calculate the sum or average of the item values.
Create new variables by calculating or recoding the values of existing variables.
User-friendly output display
Ease of use has always been recognized as an important feature of the MAXQDA product family.
And with MAXQDA Analytics Pro, we’ve extended our high standard of usability in the realm of statistical analysis.
The integrated output display is just one of the many features we’ve implemented to fulfill this promise.
But it is one of the main ones: every table and graph is sent to the output viewer with just one click.
No matter what you do in the meantime – the output will be waiting to be transferred to your report with a simple copy and paste.




Davies Onduru (verified owner) –
Abdullah A. (verified owner) –
rapid and reliable
Sylvain (verified owner) –
Reliable and efficient, thanks !