
Description
How to Purchase
✅ Instant Delivery (No Physical Delivery Required)
✅ Before you buy, make sure you read the Terms and Conditions
✅ If you agree to buy, you have agreed to the terms and conditions of no refunds if the reason is as described Terms and Conditions
✅ License for one PC, and cannot be transferred to another PC
✅The license file will work on the PC where is activated
✅ Active Period: Lifetime (can reinstall), Warranty 1 Years
✅ Support: Windows 10, 11
✅ Update Application: No
✅ Install Instructions: Available (video/text)
✅ It should be noted, buying = understanding product use
Note:
Files & Prices may increase or decrease at any time
ORDER PASS 2025.2 GO HERE
Description
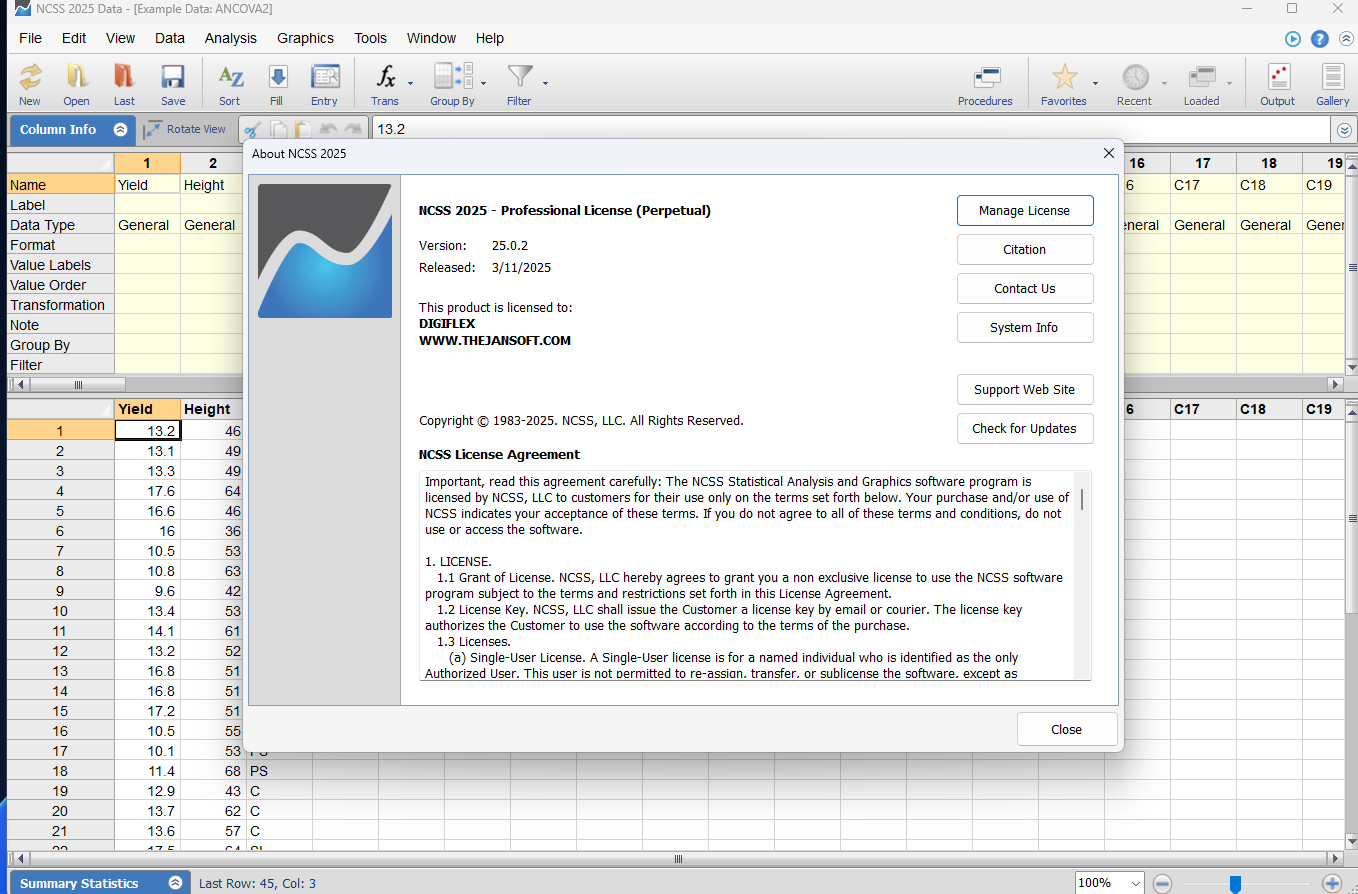
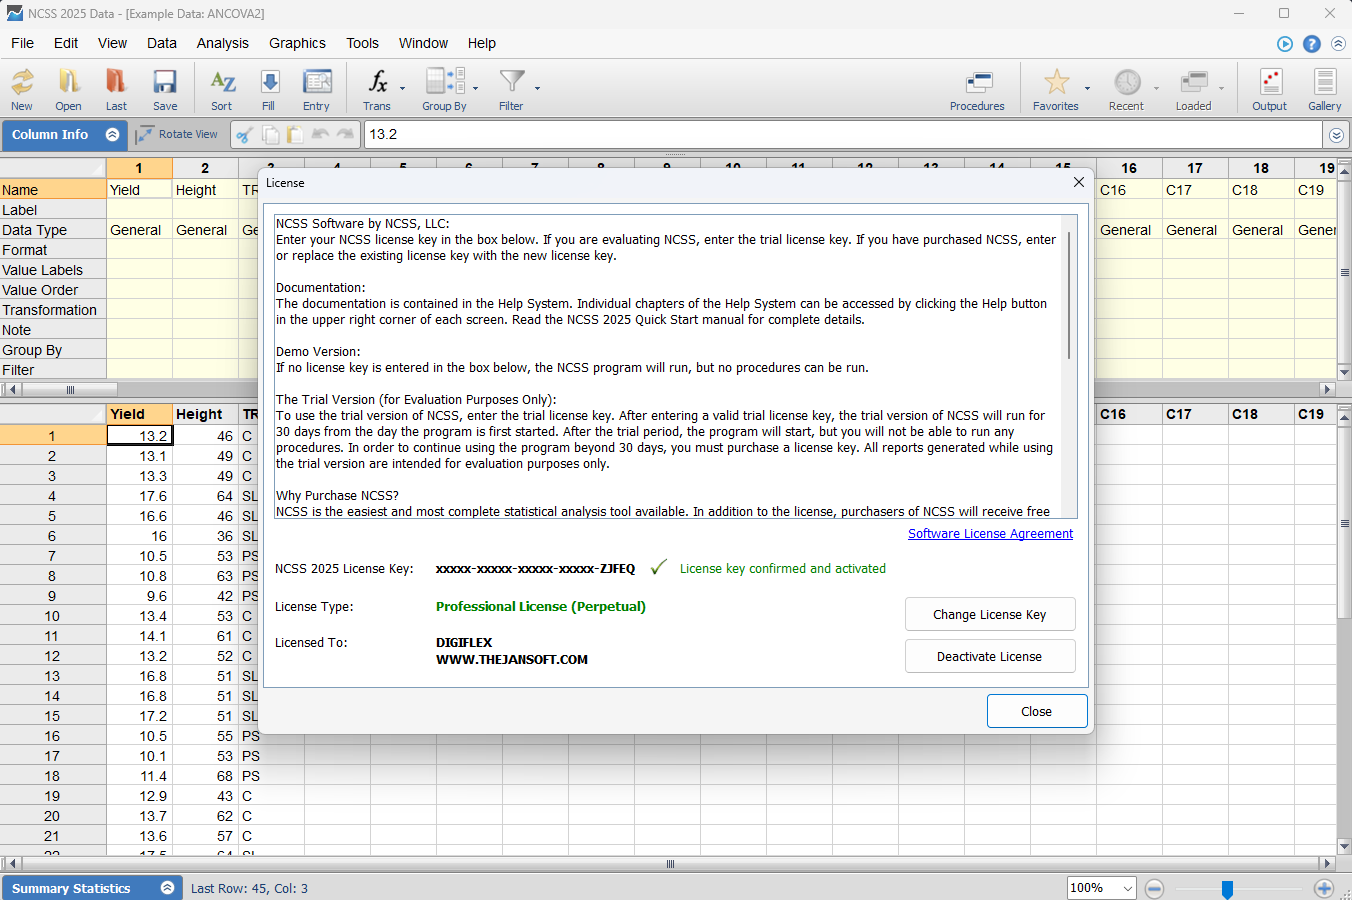
NCSS 2025 Version 25.0.2
Released: March 11, 2025
Statistical, Graphics, and Sample Size Software
For over 30 years, NCSS, LLC has been dedicated to providing researchers, investigators, academics, scientists, and other professionals with quality statistical software that is comprehensive and accurate but still intuitive and easy to use.
Our two solutions, NCSS and PASS, are used world-wide by researchers in many industries and are renowned for accuracy, ease-of-use, graphical excellence and affordability. These statistical programs are used by thousands of customers including individual professionals and academics, as well as in collaborative efforts within large institutions.
Specifications
Recommended for most users
- 32-bit (x86) or 64-bit (x64) processor
- Windows 11 or later
- Windows 10
- Windows 8.1
- Windows 8
- Windows 7
- Windows Vista with Service Pack 2 or higher
- Windows Server 2019 or later
- Windows Server 2016
- Windows Server 2012 R2
- Windows Server 2012
- Windows Server 2008 SP2/R2
Data Analysis, Graphics
NCSS software provides a complete and easy-to-use collection of hundreds of statistical and graphics tools to analyze and visualize your data.
You can begin a free trial, watch the video to the right, or view the info-graphics below to learn more about the wide-ranging capabilities of NCSS.
NCSS software for data analysis comes complete with integrated documentation, free training videos, and full phone and email support from a team of PhD statisticians.
Discover the product that thousands of researchers, consultants, professionals, engineers, and scientists are using worldwide.
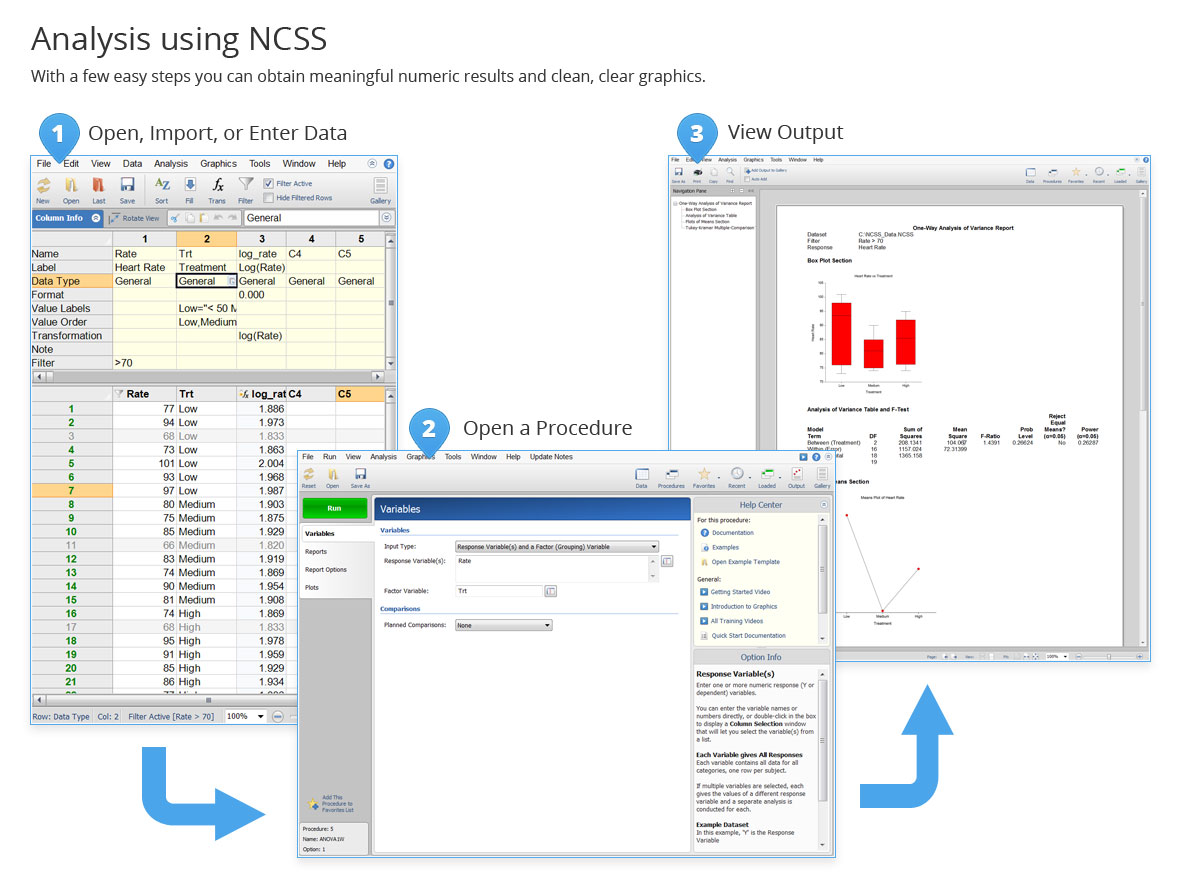
Analysis Using NCSS
With a few easy steps you can obtain meaningful numeric results and clean, clear graphics.
Use the Data window to import or enter your data. Open an NCSS procedure for your desired analysis. Select the columns and run the analysis to obtain accurate and easy-to-read numeric output and graphics.
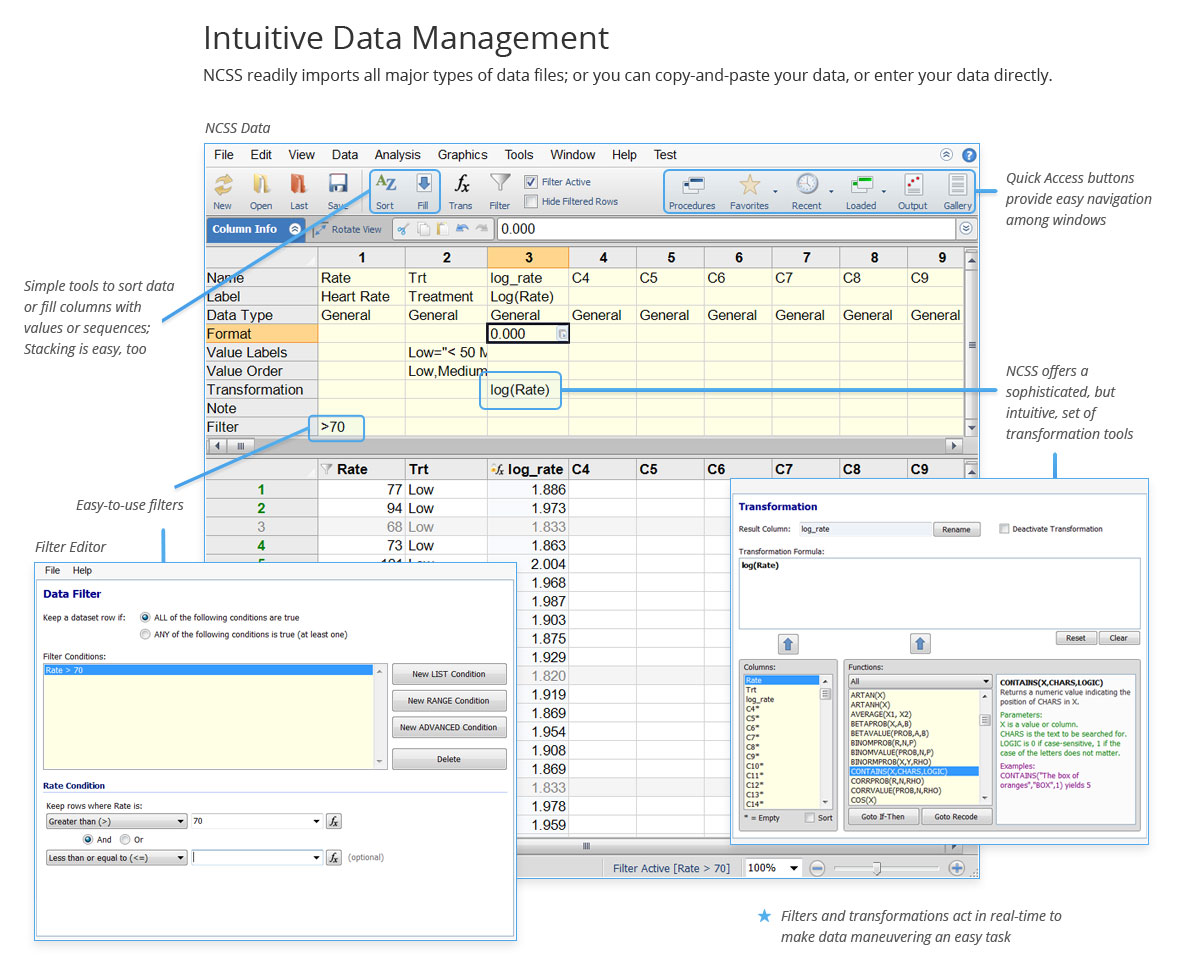
Intuitive Data Management
NCSS readily imports all major types of data files; or you can copy-and-paste your data, or enter your data directly. NCSS has excellent filtering and transformation features for managing your data.
- NCSS Data File (*.NCSS)
- Access Database
(*.ACCDB; *.MDB) - dBase File (*.DBF)
- Epi Info File (*.REC)
- Excel File (*.XLSX; *.XLS)
- Gauss File (*.DAT)
- JMP File (*.JMP)
- Matlab File (*.MAT)
- Minitab File (*.MTW)
- R File (*.RData)
- SAS File (*.SD2;*.SAS7BDAT…)
- SPLUS File (*.DAT)
- SPSS File (*.SAV; *.POR)
- Stata File (*.DTA)
- Statistica File (*.STA)
- Systat File (*.SYS; *.SYZ)
- Text File (*.TXT;*.PRN;*.CSV)
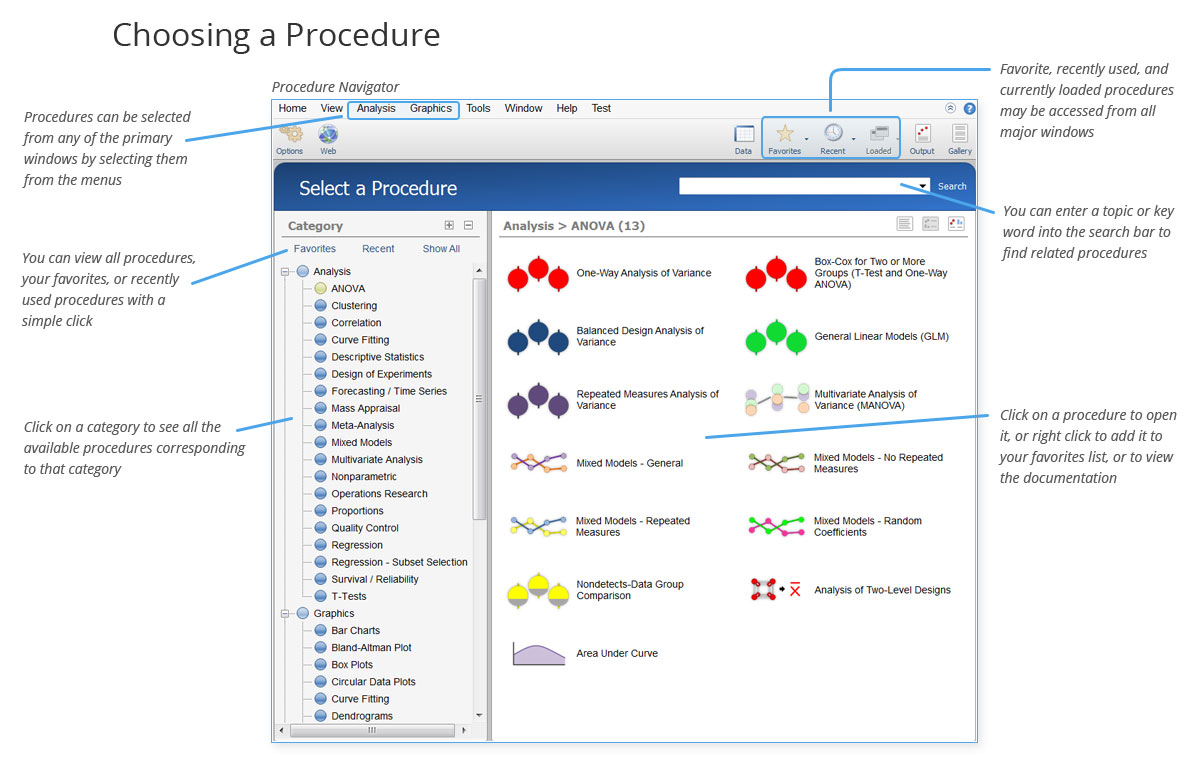
Choosing A Procedure
Finding the right analysis or graphics procedure is easy using the drop-down menu, the procedure search, or the category tree. Watch a short video to learn how to select your desired procedure in NCSS.
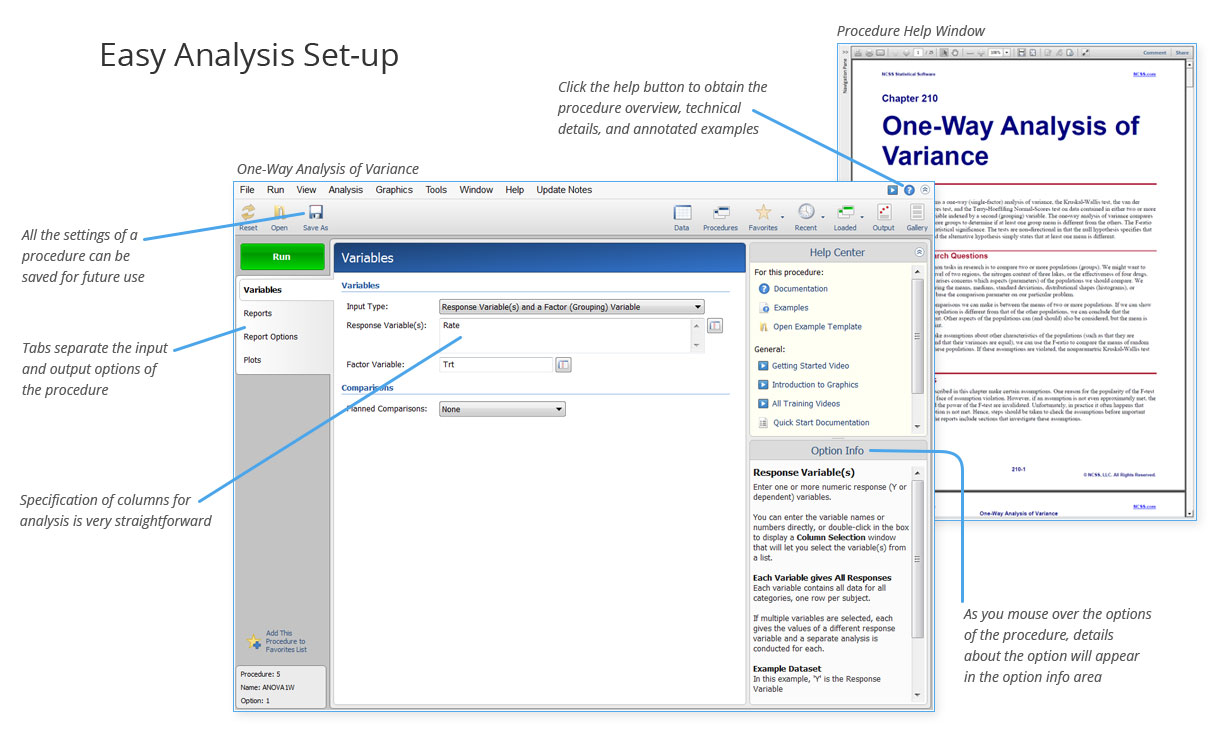
Easy Analysis Set-up
The analysis and graphics tools are easy to use and have built-in help messages for every option.
Select the columns to be analyzed, choose the desired reports and plots, and click Run to obtain your results. Watch this video to learn more.
And if you need additional help, the complete documentation for each procedure is just a click away.
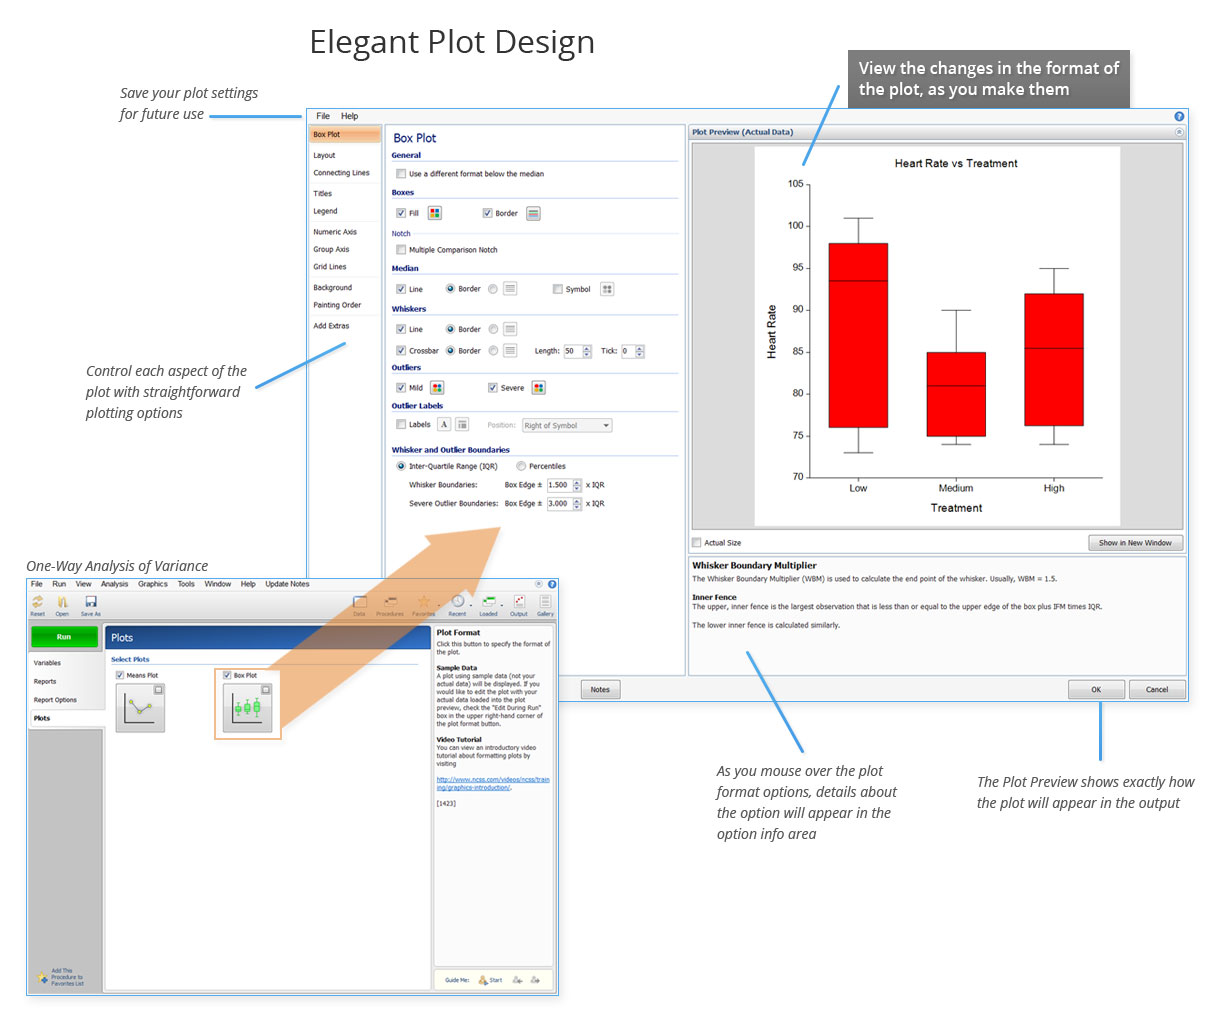
Elegant Plot Design
There are over 80 plots available in NCSS. Some plots are part of a general analysis procedure such as analysis of variance or regression, while other plots are standalone tools.
All NCSS plots are highly customizable. Users are given control of the layout, symbols, titles, legend, axes, grid lines, and more. Plot settings are easily saved for future use or for sharing.
A variety of training videos are available through this website, featuring each aspect of plotting in NCSS. Click here to watch a graphics introduction video.
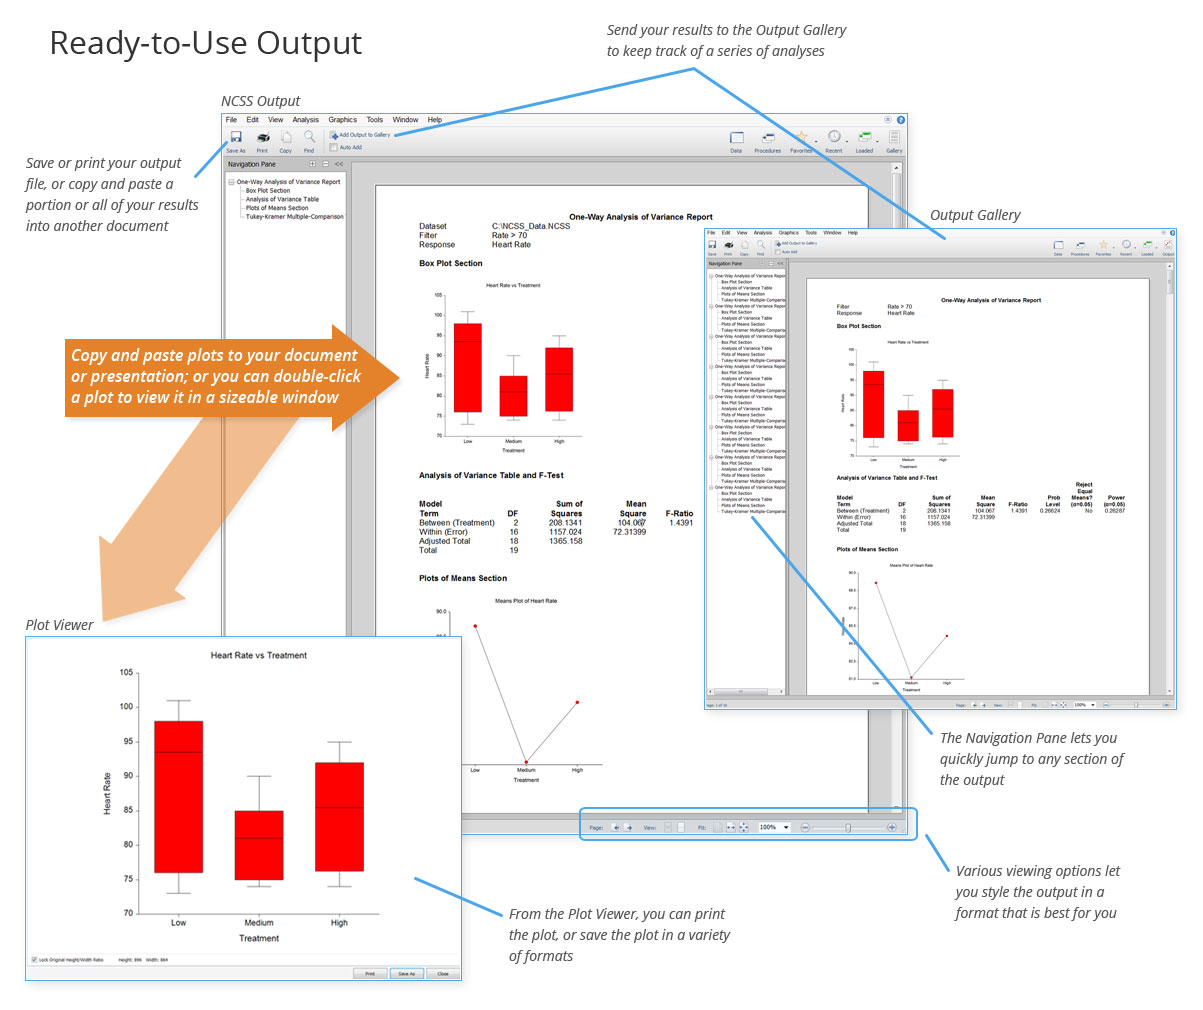
Ready to Use Output
When an NCSS procedure is run, the analysis results and the desired plots are displayed in the output window. All graphics can be clicked to be shown in a separate window for viewing or saving.
Navigation of the output is easy with the output navigation tree. The output and graphics are ready to be viewed, copied and pasted, or saved. Multiple output runs can be sent to the output gallery for saving or for comparing analyses.
To take a video tour of the output window in NCSS, click here.
Reviews
There are no reviews yet