Sale!

SigmaPlot 16 Full Version | makes it easy to create and customize violin plots

Indonesian rupiah (Rp) - IDR
  • United States dollar ($) - USD
  • Indonesian rupiah (Rp) - IDR
  • Euro (€) - EUR

Original price was: Rp1,250,000.00.Current price is: Rp375,000.00.

1 item sold

FOR INTERNATIONAL PAYMENTS AT CHECKOUT, CHANGE CURRENCY TO IDR FOR CREDIT CARD/DEBIT CARD, AND FOR PAYPAL CHANGE CURRENCY TO USD

Easy Download

After filling in the information and payment is successful and verified, will get a link to download the program

30 Days Warranty

You have the right to return your orders within 30 days.

Secure Payment

Your payments are secure with our private security network.

Description

How to Purchase

✅ Instant Delivery (No Physical Delivery Required)

✅ Before you buy, make sure you read the Terms and Conditions

✅ If you agree to buy, you have agreed to the terms and conditions of no refunds if the reason is as described Terms and Conditions

✅ License for one PC, and cannot be transferred to another PC

✅ Licence for 1 computer (uninstall windows Licence can still be used)

✅ Active Period: Lifetime

✅ Support: Windows 10, 11

✅ Update Application: No

✅ Install Instructions: Available (video/text)

✅ It should be noted, buying = understanding product use

SigmaPlot 16 New Features

Violin Plot

Visualize Data Distributions with Clarity and Precision
SigmaPlot 16 brings you a powerful new macro for data visualization – Violin Plots. This innovative macro offers a more comprehensive and informative way to depict the distribution of numerical data for one or more groups.

What are Violin Plots ?

Violin Plot is used to visualize the distribution of numerical data of different variables. It depicts distributions of numeric data for one or more groups using density curves. The width of each curve corresponds with the approximate frequency of data points in each region.  

Use the New Violin Plot Macro when you want to observe the distribution of numeric data, these are especially useful when you want to make a comparison of distributions between multiple groups. The peaks, valleys, and tails of each group’s density curve can be compared to visualize similarities and differences within groups.

Butterfly Plots

Unlock the Potential of Your Data with Butterfly Plots

With SigmaPlot 16’s Butterfly Plots, you can take your data analysis to the next level. Download a free trial today and experience the power of this innovative visualization tool.

What are Butterfly Plots?

Butterfly plot is a type of bar chart that utilizes a unique visual style to highlight differences between two datasets. By comparing the lengths of the bars and their associated error bars, you can easily identify significant variations.

Confidence and Prediction Bands

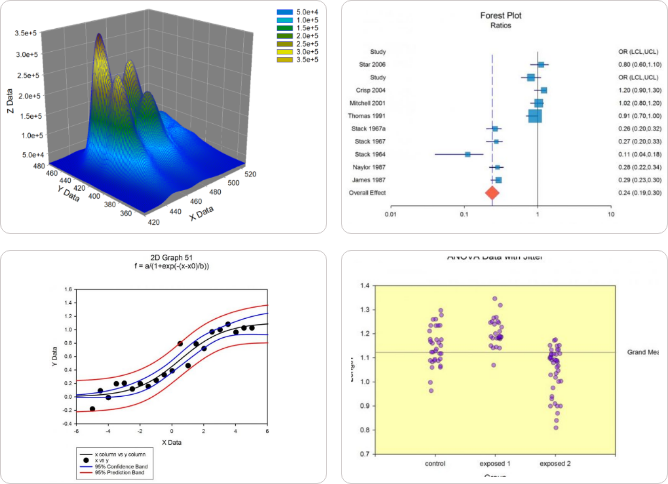
What are Confidence and Prediction Bands?

Confidence and Prediction bands are used to evaluate the rightness of fit in regression and to predict future data points.

This feature in SigmaPlot facilitates users to create confidence and prediction bands for regression. Earlier versions of the product supported Confidence and Prediction lines, however, now users can create bands for the same.

Key Benefits of Confidence & Prediction Bands in SigmaPlot v16:
  • Enhanced Data Interpretation: Visualize uncertainty and identify regions of higher/lower confidence. 
  • Improved Decision-Making: Quantify risk and make informed decisions.
  • Better Model Evaluation: Assess model fit and identify outliers/anomalies.
  • Effective Communication: Clearly communicate uncertainty and variability in results.

Macro to Import Multiple Excel Sheets

What is the Excel Multi-sheet Import Macro?

This feature facilitates the user to import multiple sheets with defined ranges from an Excel file. The user can import multiple sheets with different ranges. Additional statements need to be added for every sheet along with the import statement. This would remain the same as it facilitates backward compatibility (Considering that all previous versions can import only the first sheet (Which remains same to support backward compatibility, which imports only the first sheet in an excel file).

Error Bars

Visualize Uncertainty with Precision: Introducing Error Bars in SigmaPlot v16
What are Error Bands?

Error bars are a crucial tool in data visualization, providing valuable insights into the reliability and variability of data. They can represent confidence intervals, standard errors, standard deviations, or other relevant quantities. By visualizing uncertainty, error bars help prevent misinterpretation of data, avoid overestimating precision, and highlight significant differences between groups.

SigmaPlot Helps You Quickly Create Exact Graphs

With the new Graph Properties user interface you can select the property category in the tree on the left and then change properties on the right. The change is immediately graphed and if you move your cursor off the panel then it becomes transparent and you can see the effect of your changes without leaving the panel.

The “select left and change right” procedure makes editing your graphs quick and easy. SigmaPlot takes you beyond simple spreadsheets to help you show off your work clearly and precisely. With SigmaPlot, you can produce high-quality graphs without spending hours in front of a computer. SigmaPlot offers seamless Microsoft Office® integration, so you can easily access data from Microsoft Excel® spreadsheets and present your results in Microsoft PowerPoint® presentations.

The user interface also includes Microsoft Office style ribbon controls. And the tabbed window interface efficiently organizes your worksheets and graphs for easy selection. And these tabs may be organized into either vertical or horizontal tab groups. Graph Gallery and Notebook Manger panes may be moved to any position and easily placed using docking panel guides. You can add frequently used objects to the Quick Access Toolbar. For example you might want to add Notebook Save, Close All, Refresh Graph Page and Modify Plot.​

More than 100 2-D and 3-D technical graph type

From simple 2-D scatter plots to compelling contour and the new radar and dot density plots, SigmaPlot gives you the exact technical graph type you need for your demanding research.

Use Global Curve Fitting to simultaneously analyze multiple data

Global curve fitting is used when you want to fit an equation to several data sets simultaneously. The selected equation must have exactly one independent variable.

Obtain Data from Nearly Any Source

SigmaPlot has import file formats for all common text files. This includes a general purpose ASCII file importer which allows importing comma delimited files and user-selected delimiters.

SigmaPlot Features

Choose from a wide range of graph types to best present your results

From simple 2-D scatter plots to compelling contour and the new radar and dot density plots, SigmaPlot gives you the exact technical graph type you need for your demanding research.

Statistical Analysis is no longer a daunting task

SigmaPlot now offers almost 50 of the most frequently used statistical tests in scientific research by integrating SigmaStat into one application. Suggestion of the most appropriate statistical tests is offered by a software-based Advisor. Raw and indexed data formats are accepted to avoid data reformatting.

Share high-quality graphs and data on the Web

Export your graphs as high-resolution, dynamic Web pages – not simple GIF or JPEG files. Viewers can explore data used to create graphs and zoom, pan or print images at full resolution directly from a Web Browser. Automatically generate active Web objects from your graphs or embed the objects within other Web pages.

Import

Export

Graphing software that makes data visualization easy

Graph creation starts with SigmaPlot’s award-winning interface. Take advantage of ribbon collections of common properties, tabbed selection of graphs, worksheets and reports, right mouse button support and graph preferences. Select the graph type you want to create from the Graph Toolbar’s easy-to-read icons. The interactive Graph Wizard leads you through every step of graph creation. You get compelling, publication-quality charts and graphs in no time. SigmaPlot offers more options for charting, modeling and graphing your technical data than any other graphics software package.

Customize every detail of your charts and graphs

SigmaPlot offers the flexibility to customize every detail of your graph. You can add axis breaks, standard or asymmetric error bars and symbols; change colors, fonts, line thickness and more. Double-click on any graph element to launch the Graph Properties dialog box. Modify your graph, chart or diagram further by pasting an equation, symbol, map, picture, illustration or other image into your presentation. And select anti-aliasing to display jaggy-free smooth lines that can be used in your PowerPoint® presentations.

Quickly Plot your Data from Existing Graph Templates in the Graph Style Gallery

Save all of the attributes of your favorite graph style in the Graph Style Gallery. Add greater speed and efficiency to your analysis by quickly recalling an existing graph type you need and applying its style to your current dataset.

Publish your charts and graphs anywhere

Create stunning slides, display your graphs in reports or further customize your graphs in drawing packages. Save graphs for publication in a technical journal, article or paper with SigmaPlot’s wide range of graphic export options. Presenting and publishing your results has never been easier – or looked this good.

Data Analysis Doesn’t Get Much Easier

SigmaPlot provides all the fundamental tools you need to analyze your data from basic statistics to advanced mathematical calculations. Click the View Column Statistics button to instantly generate summary statistics including 95% and 99% confidence intervals. Run t-tests, linear regressions, non-linear regressions and ANOVA with ease. You can fit a curve or plot a function and get a report of the results in seconds. Use built-in transforms to massage your data and create a unique chart, diagram or figure. With SigmaPlot – it’s all so simple!

Use SigmaPlot within Microsoft Excel

Access SigmaPlot right from your active Microsoft Excel worksheet. Tedious cut-and-paste data preparation steps are eliminated when you launch SigmaPlot’s Graph Wizard right from the Excel toolbar. Use Excel in-cell formulas, pivot tables, macros and date or time formats without worry. Keep your data and graphs in one convenient file.

Transforms and Quick Transforms

Generate simulated data or modify worksheet columns of data with transforms. Create simple one-line transforms with the Quick Transforms feature that walks you through transform implementation. Or create extremely complex transforms with hundreds of lines of code.

Use the Regression Wizard to fit data easily and accurately

Fitting your data is easy with the SigmaPlot Regression Wizard. The Regression Wizard automatically determines your initial parameters, writes a statistical report, saves your equation to your SigmaPlot Notebook, and adds your results to existing graphs or creates a new one!

Use the Dynamic Curve Fitter to determine if your fit is valid

The Dynamic Curve Fitter performs 200 or more curve fits using your equation and data starting from optimally different initial starting values. The results are ranked by goodness of fit so that you can check the top ranked results against the result you obtained from the Regression Wizard.

Plot Nearly ANY Mathematical Function

Plotting user-defined and parameterized equations is only a mouseclick away with the Plot Equation feature. Just type the function or select one from the built-in library and specify the parameters and the range. It’s that simple! Create your own built-in functions and save them for future use. Plot functions on new or existing graphs or plot multiple functions simultaneously using different parameter values. Save plotted X and Y results to the worksheet.

Maximize your Productivity with SigmaPlot’s Automation

Automate Complex Repetitive Tasks

Create macros in no time with SigmaPlot’s easy-to-use macro language. Not a programmer? No problem. With SigmaPlot, you can record macros by point-and-click with the macro recorder. Use macros to acquire your data, execute powerful analytical methods, and create industry-specific or field-specific graphs. Use one of the thirty built-in macros as provided or use these macros as a base to quickly create your own macros.

Share the power of SigmaPlot with less-experienced users by using macros to tailor the SigmaPlot interface for your particular application. Create custom dialog boxes, menu choices and forms to help guide novice users through a session.

New Worksheet Features Include

SigmaPlot’s Notebook Functionality

Automate Routine and Complex Tasks

Symbol Types

SigmaPlot Report Editor

Page Layout and Annotation Options

Reviews

There are no reviews yet

Only logged in customers who have purchased this product may leave a review.

Frequent questions about licenses

We will send the license to your email, after you send the HWID serial as we explained in the text guide or video guide.

for 1 PC variation, the license cannot be transferred to another computer.
for UNLIMITED PC variation, the license can be transferred and used on other computers

license will be able to be used forever as long as there is no ssd/hard drive hardware change.

Add to cart